Introduction to Trading View and Its Key Features
In today’s fast-paced trading environment, having access to accurate, real-time market data coupled with powerful analytical tools is essential for traders and investors alike. trading view has established itself as a premier platform that combines advanced charting, social networking, and market analysis, making it a vital resource for both beginners and seasoned professionals. This comprehensive guide explores the core functionalities of Trading View, how to harness its features effectively, and strategies to enhance your trading performance using this versatile platform.
Core Tools and Charting Capabilities
Advanced Charting Environment
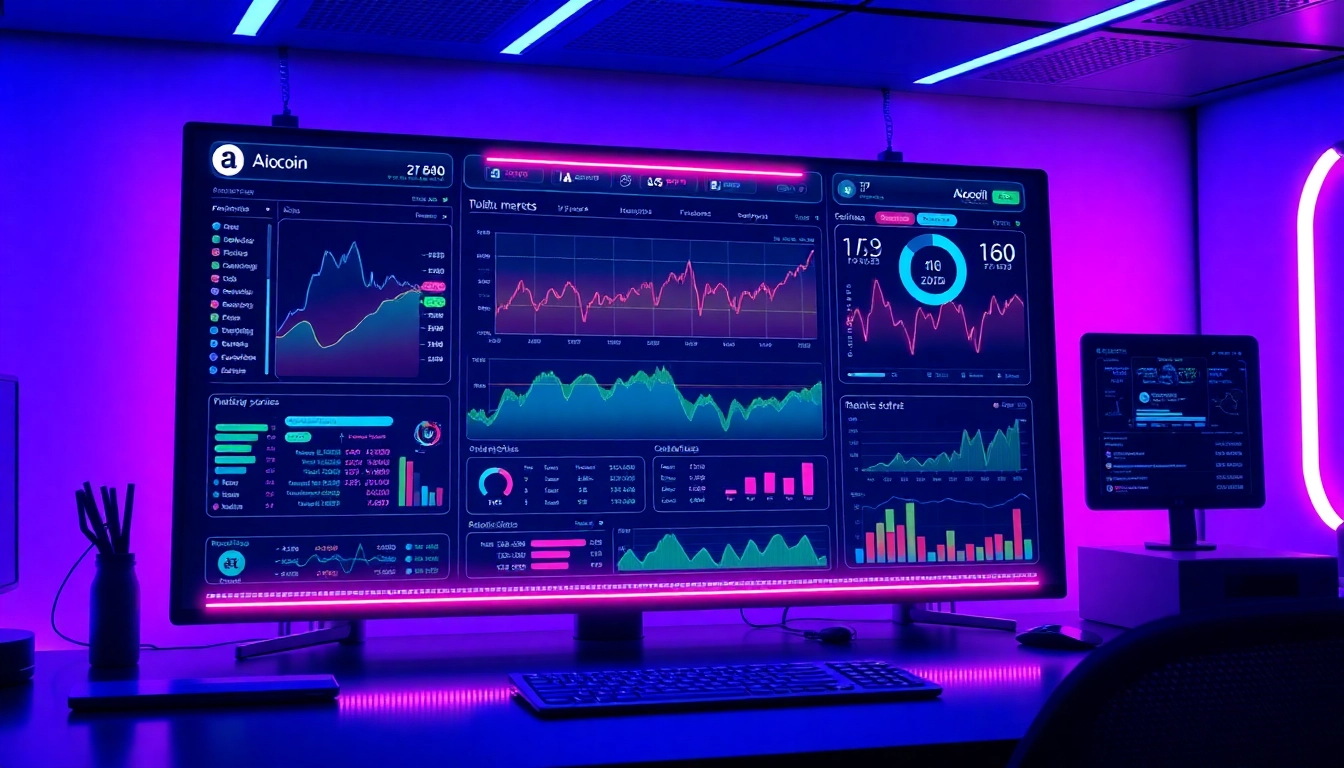
At the heart of Trading View lies its sophisticated charting system, which offers an extensive array of tools designed for precise technical analysis. Users can access real-time data for stocks, cryptocurrencies, forex, commodities, and indices, all within customizable chart layouts. The platform supports a multitude of chart types—candlestick, line, bar, and area charts—allowing traders to select the visualization that best fits their analysis style. Furthermore, Trading View’s charting interface enables users to draw trend lines, Fibonacci retracements, and geometric patterns directly onto the graphs, facilitating detailed technical assessments.
Indicators and Overlay Tools
Trading View boasts an extensive library of technical indicators, including moving averages, RSI, MACD, Bollinger Bands, and Ichimoku Cloud. Users can apply multiple indicators simultaneously, adjust parameters, and create custom scripts using Pine Script, Trading View’s proprietary scripting language. These features empower traders to develop tailored strategies and identify potential entry and exit points with greater confidence.
Real-Time Data and Multi-Asset Integration
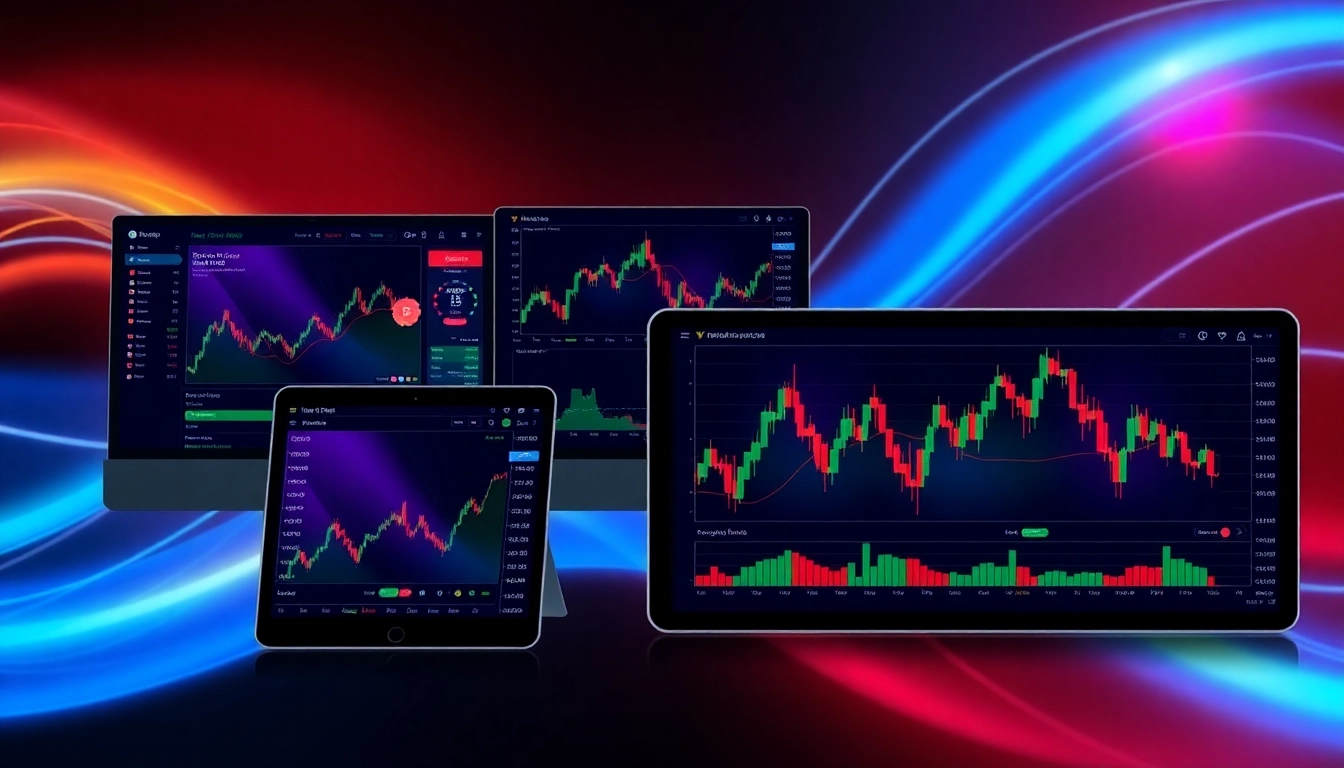
One of Trading View’s standout features is its ability to integrate real-time data feeds from a multitude of global exchanges. Whether analyzing the NYSE, NASDAQ, crypto markets, or forex pairs, traders have instant access to live price updates. Additionally, the platform’s multi-asset support ensures that traders can switch seamlessly between different markets, enabling comprehensive portfolio analysis and diversification strategies.
Integrating Market Data for Better Decisions
Market Sentiment and Social Integration
Beyond raw data, Trading View integrates social networking elements that allow traders to share ideas, analyze community-sourced insights, and gauge market sentiment. Community ideas and published analyses serve as valuable resources for understanding prevailing market trends, identifying emerging opportunities, and refining trading hypotheses.
News and Economic Calendar
Embedded economic calendars provide scheduled releases of key economic indicators such as GDP, employment reports, and inflation data. These insights help traders anticipate market volatility and adapt their strategies accordingly, combining fundamental analysis with technical insights for more comprehensive decision-making.
Historical Data and Backtesting
Historical market data is accessible on Trading View, aiding traders in backtesting strategies across different timeframes. With the platform’s Strategy Tester, users can simulate trades based on historical price movements, evaluate the robustness of their strategies, and optimize parameters before deploying them live—minimizing risk and improving potential returns.
How to Use Trading View for Effective Market Analysis
Setting Up Custom Watchlists and Alerts
Efficient market analysis begins with personalized watchlists that track selected assets in real-time. Users can create customized lists to monitor favorite stocks, cryptocurrencies, or indices, ensuring quick access to relevant data. Additionally, setting up alerts based on price levels, indicator signals, or pattern formations keeps traders informed of potential trading opportunities without constantly watching the charts.
Interpreting Technical Indicators and Patterns
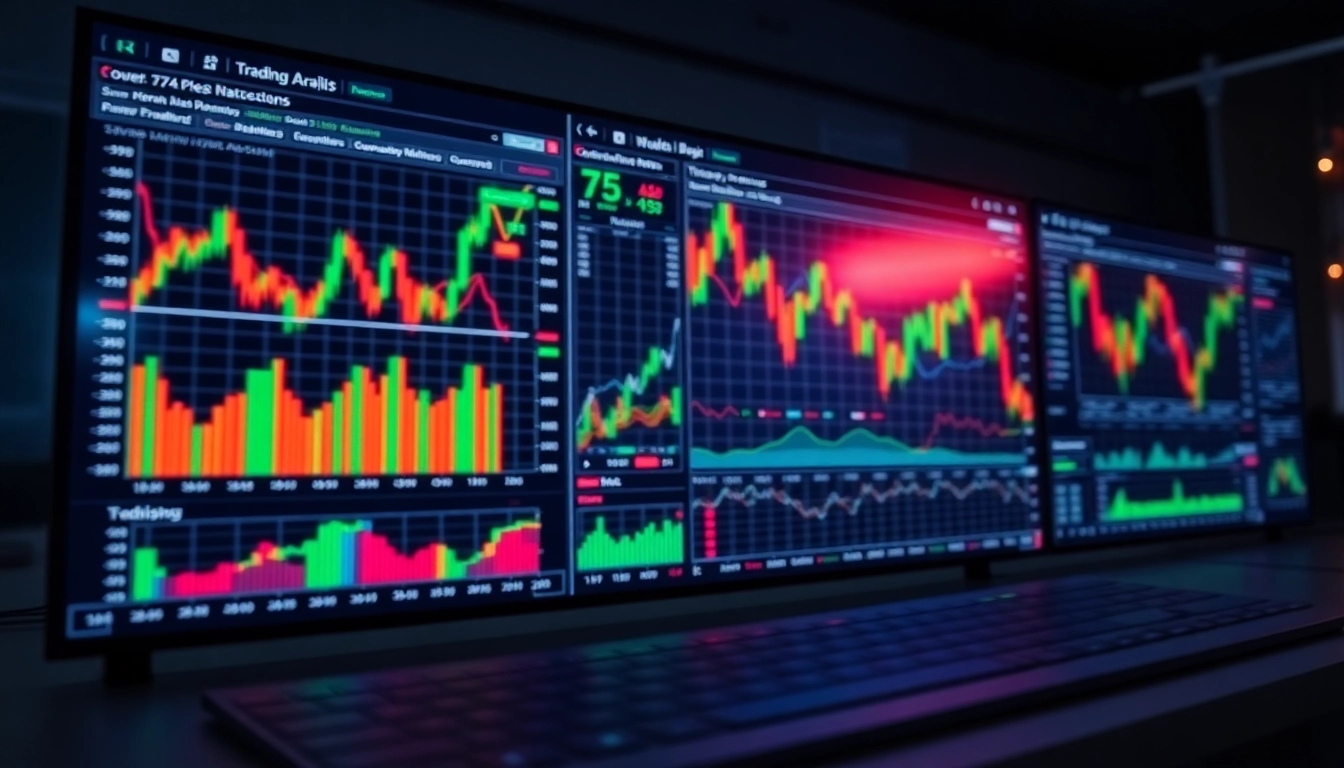
Key to successful trading is understanding how indicators and chart patterns signal potential market moves. For example, moving average crossovers can indicate trend reversals, while support and resistance levels can highlight entry and exit points. Recognizing patterns such as Head and Shoulders, Double Tops/Bottoms, and Flag formations helps traders anticipate future price directions, especially when backed by corroborating indicator signals.
Utilizing Social Features for Trading Insights
Trading View’s social platform enables users to follow popular traders, participate in discussion groups, and share analysis publicly or privately. Leveraging community insights can provide diversified perspectives, identify consensus on market directions, and foster collaborative learning. This communal aspect adds an extra layer of analysis, often revealing market biases and sentiment shifts ahead of technical triggers.
Strategies to Maximize Trading View Performance
Create Personalized Trading Strategies
Developing personalized trading strategies on Trading View involves combining multiple indicators, chart patterns, and market analysis techniques. Traders should begin by defining their risk tolerance, preferred timeframes, and asset classes. Using Pine Script, users can automate entry, exit, and risk management rules, creating semi-automatic or fully automated trading systems that execute based on predefined signals.
Automating Alerts and Notifications
Automation is vital for timely decision-making. Trading View’s alert system allows setting notifications on price levels, indicator crossings, or pattern recognitions. Alerts can be configured to send email, SMS, or platform notifications, ensuring traders respond swiftly to market movements—especially important in volatile markets like cryptocurrencies or forex.
Optimizing Chart Layouts for Speed and Clarity
Effective traders customize their chart layouts for clarity and efficiency. Organizing multiple charts in grid layouts, assigning distinct color schemes, and storing presets streamline the analysis process. Keyboard shortcuts and hotkeys further enhance speed, facilitating rapid switching between tools and timeframes during live trading sessions.
Advanced Tips for Serious Traders
Leveraging Multiple Timeframes for Precision
Using multiple timeframes allows traders to align short-term signals with longer-term trend perspectives. For example, a trader might analyze daily charts to identify the primary trend, then narrow down to hourly or minute charts for precise entries. Confirming signals across multiple timeframes reduces false positives and improves trade reliability.
Backtesting and Strategy Testing on Trading View
Backtesting provides critical insight into the historical performance of trading strategies. Trading View’s Strategy Tester allows traders to simulate past trades over various periods, optimize entry and exit points, and assess performance metrics such as drawdown, win rate, and profit factor. These insights guide strategy refinement before risk exposure in live markets.
Collaborating and Sharing Analysis with the Community
Collaboration amplifies learning. Sharing charts, strategies, and insights with the Trading View community enables feedback, validation, and the development of new trading ideas. Engaging with other traders broadens perspectives, exposes traders to different analysis techniques, and facilitates continuous improvement.
Measuring Success and Improvements with Trading View
Tracking Performance Metrics Regularly
Progress in trading requires ongoing monitoring of key performance indicators like win rate, average profit/loss, and risk-adjusted returns. Trading View’s analytics tools allow traders to evaluate the effectiveness of their strategies and make data-driven adjustments.
Adjusting Strategies Based on Market Feedback
The markets are dynamic; therefore, adapting strategies based on analytical feedback is crucial. Regularly reviewing trade outcomes, recognizing pattern failures, and refining technical parameters ensures strategies stay aligned with current market conditions, improving longevity and profitability.
Staying Updated with New Features and Tools
Trading View continuously updates with new features—such as AI-driven analysis, additional indicators, or enhanced automation. Staying informed about these updates through official channels enables traders to leverage cutting-edge tools, maintain competitive advantage, and evolve their trading practices.